
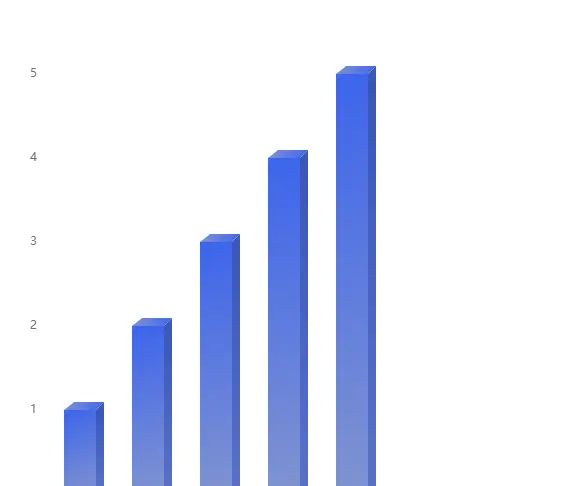
如图:
需要结合vue-echarts、echarts完成。vue-echarts官网
我这里遇到一个问题,npm vue-echarts一直失败.解决方法:npm指定下载版本号,我是下载的:
npm i vue-echarts@^6.0.0-rc.4

main.js:
import { createApp } from  vue
import App from  ./App.vue

import ECharts from  vue-echarts ;
import { graphic } from  echarts/index ;

const app = createApp(App)
app.provide( graphic , graphic);
app.component( VChart , ECharts);
app.mount( #app )
vue文件:
<template>
    <div>
        <v-chart class="chart" :option="option" />
    </div>
</template>
<script setup>
import { inject,reactive } from  vue

const graphic = inject( graphic );
// 绘制左侧面
const CubeLeft = graphic.extendShape({
  shape: {
    x: 0,
    y: 0
  },
  buildPath(ctx, shape) {
    // 会canvas的应该都能看得懂,shape是从custom传入的
    const { xAxisPoint } = shape;
    // console.log(shape)
    const c0 = [shape.x + 17, shape.y];
    const c1 = [shape.x - 15, shape.y];
    const c2 = [xAxisPoint[0] - 15, xAxisPoint[1]];
    const c3 = [xAxisPoint[0] + 17, xAxisPoint[1]];
    ctx
      .moveTo(c0[0], c0[1])
      .lineTo(c1[0], c1[1])
      .lineTo(c2[0], c2[1])
      .lineTo(c3[0], c3[1])
      .closePath();
  }
});
// 绘制右侧面
const CubeRight = graphic.extendShape({
  shape: {
    x: 0,
    y: 0
  },
  buildPath(ctx, shape) {
    const { xAxisPoint } = shape;
    const c1 = [shape.x + 17, shape.y];
    const c2 = [xAxisPoint[0] + 17, xAxisPoint[1]];
    const c3 = [xAxisPoint[0] + 25, xAxisPoint[1] - 5];
    const c4 = [shape.x + 25, shape.y - 8];
    ctx
      .moveTo(c1[0], c1[1])
      .lineTo(c2[0], c2[1])
      .lineTo(c3[0], c3[1])
      .lineTo(c4[0], c4[1])
      .closePath();
  }
});
// 绘制顶面
const CubeTop = graphic.extendShape({
  shape: {
    x: 0,
    y: 0
  },
  buildPath(ctx, shape) {
    const c1 = [shape.x + 17, shape.y];
    const c2 = [shape.x + 25, shape.y - 8]; // 右点
    const c3 = [shape.x - 5, shape.y - 8];
    const c4 = [shape.x - 15, shape.y];
    ctx
      .moveTo(c1[0], c1[1])
      .lineTo(c2[0], c2[1])
      .lineTo(c3[0], c3[1])
      .lineTo(c4[0], c4[1])
      .closePath();
  }
});

graphic.registerShape( CubeLeft , CubeLeft);
graphic.registerShape( CubeRight , CubeRight);
graphic.registerShape( CubeTop , CubeTop);
const option = reactive({
  grid: {
    left:  10% ,
    right:  5% ,
    top:  10% ,
    bottom:  20%
  },
  xAxis: {
    type:  category ,
    data: [],
    axisTick: {
      show: false
    },
    axisLine: {
      show: false,
      lineStyle: {
        type:  dotted ,
        width: 1,
        color:  #ffffff ,
        opacity: 0.5
      }
    },
    axisLabel: {
      show: true,
      color:  #ffffff ,
      interval: 0,
      rotate: 30,
      fontSize: 12
    }
  },
  yAxis: {
    type:  value ,
    splitLine: {
      // 分隔线
      show: true, // 默认显示,属性show控制显示与否
      lineStyle: {
        type:  dotted ,
        color:  #ffffff ,
        opacity: 0.5
      }
    }
  },
  series: [
    {
      type:  custom ,
      renderItem: (params, api) => {
        // console.log(params)
        const location = api.coord([api.value(0), api.value(1)]);
        return {
          type:  group ,
          children: [
            {
              type:  CubeLeft ,
              shape: {
                api,
                xValue: api.value(0),
                yValue: api.value(1),
                x: location[0],
                y: location[1],
                xAxisPoint: api.coord([api.value(0), 0])
              },
              style: {
                fill: graphic.LinearGradient(1, 1, 0, 0, [
                  { offset: 1, color:  #3d65ec  },
                  { offset: 0, color:  #8193d0  }
                ])
              }
            },
            {
              type:  CubeRight ,
              shape: {
                api,
                xValue: api.value(0),
                yValue: api.value(1),
                x: location[0],
                y: location[1],
                xAxisPoint: api.coord([api.value(0), 0])
              },
              style: {
                fill: new graphic.LinearGradient(1, 1, 0, 0, [
                  { offset: 1, color:  #3755b8  },
                  { offset: 0, color:  #5972cb  }
                ])
              }
            },
            {
              type:  CubeTop ,
              shape: {
                api,
                xValue: api.value(0),
                yValue: api.value(1),
                x: location[0],
                y: location[1],
                xAxisPoint: api.coord([api.value(0), 0])
              },
              style: {
                fill: new graphic.LinearGradient(1, 1, 0, 0, [
                  { offset: 1, color:  #8193d0  },
                  { offset: 0, color:  #3d65ec  }
                ])
              }
            }
          ]
        };
      },
      data: [1,2,3,4,5]
    }
  ]
});

// })


</script>
<style>
.chart {
  width:  400px;
  height: 600px;
}
</style>
© 版权声明
文章版权归作者所有,未经允许请勿转载。
相关文章


您必须登录才能参与评论!
立即登录


博主 请教下 为啥我本地 展示是对的 但是 线上环境这个柱状图一直不显示y轴数据报了这个错误 Cannot add property colorStops, object is not extensible 不知道你有没有遇到过
没有遇到过,抱歉